GPS Spoof Detection
Jun 01, 2016
Meaconing, is a form of GPS spoofing in which artificial signals are generated that appear to articulate an actual GPS signal. We show a method of generating software which mimics meaconed data.
Project Summary:
GPS Spoof Detection Consulting Project
Background Rationale
- “Meaconing,” is a form of GPS spoofing in which artificial signals are generated that appear to articulate an actual GPS signal.
- Receiver Autonomous Integrity Monitoring (RAIM) has been considered an inadequate defense to Meaconing since around 2008, when it was shown at a GNSS meeting that a device can be built which can create “believable enough signals,” with sufficiently low error rates, by capturing receiver tracking loops, and adjusting the spoofer power levels. This is known as a, “Humphrey’s Class Spoofer.”
- A new method of defense against Meaconing is to use the motions of a small antenna moving at high frequency, and use the measurement of the corresponding carrier-phase oscillations, to evaluate whether they are more consistent with spoofed signals or real signals.
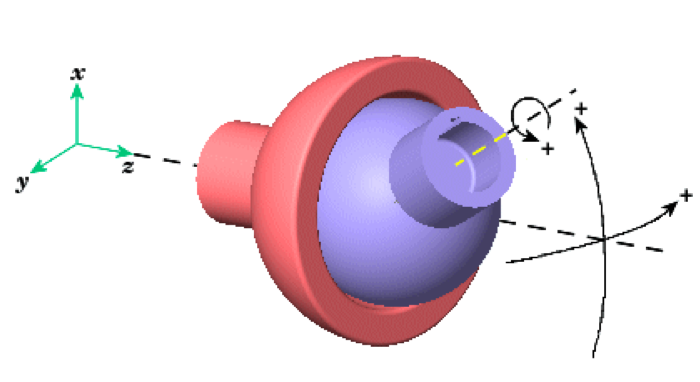
- Our assumption for this project was that a reliable device will use an, “articulating UE GNSS patch antenna,” which is mounted on a form of antenna articulation mechanism, as shown below. The antenna would have two or three rotational degrees of freedom.
- The articulation system would have a set coordinate system, and there would be a UE GNSS receiver signal processing and spoof detection unit. This entire assembly, including the antenna and receiver would be mounted onto a vehicle or boat.
Any received spoofed or meaconed signals picked up by the GNSS satellites could be ignored, because the signal processor/receiver would be able to detect on-site that those signals are false. The number of phase cycles on the carrier wave detected by the signal processor/receiver should increase as antenna arm moves closer, since there is less distance traveled.
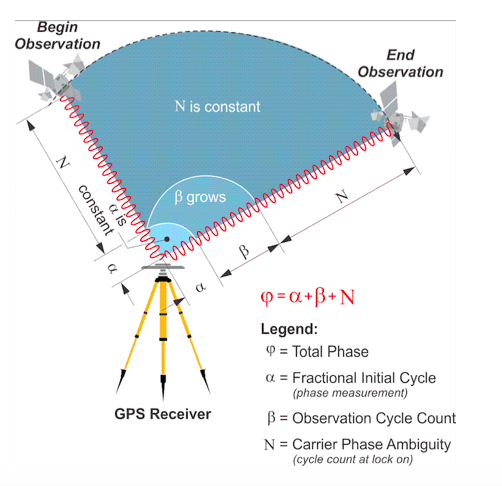
- The received carrier phases at the antenna are sensitive to the projections of the motion onto the line of site (LOS) directions of the received signals, along the direction of the line of site to each satellite.
- However the spoofed signals would have carrier phases without high variation - in essence they would all be, “averaged out,” and look like one signal, since the spoofed signal fundamentally only has one direction vector to the victim antenna.
- Simply put, three satellites are always positioned in wide degrees of variation from one another, while a spoofer would be sending three signals from one particular point.
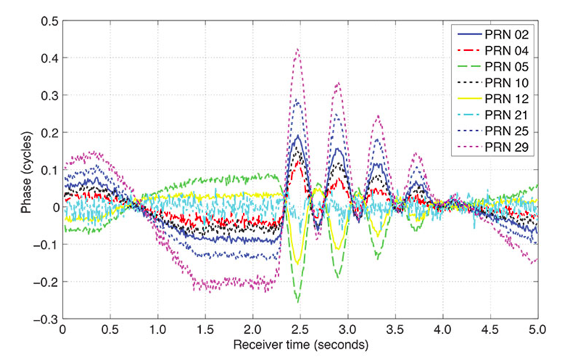
Typical, Actual GPS Data from Articulating Antenna Arm
Note that this data from 8 different satellite signals is shown, varying in phase cycle magnitude based upon the movement of the arm.
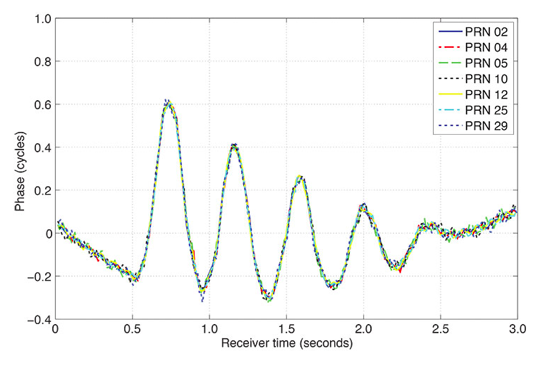
Spoofed or “Meaconed” Data
Modeling this Out In Matlab
Lacking an experimental setup, we can mimic phase cycle magnitude data over time in MATLAB by setting up a few data points, and then using a fit() function to build a function that will give us data similar to experimentally collected data.
We can first use a waveform generator tool which has a GUI that allows us to put data points onto a graph to form a function which gives a number of datapoints.
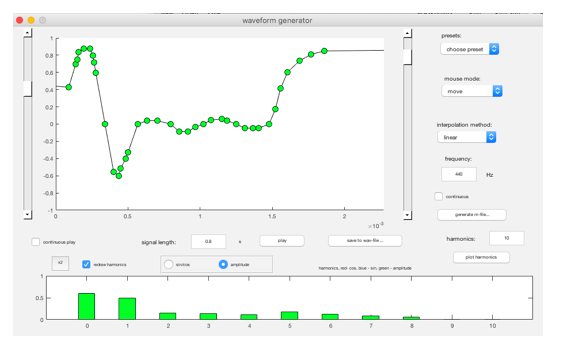
Once we have set up a set of data points which are similar to our experimental data above, essentially mimicking the articulating arm, then we can use the MATLAB fit() function, which is a part of the curve fitting toolbox, to build a function.
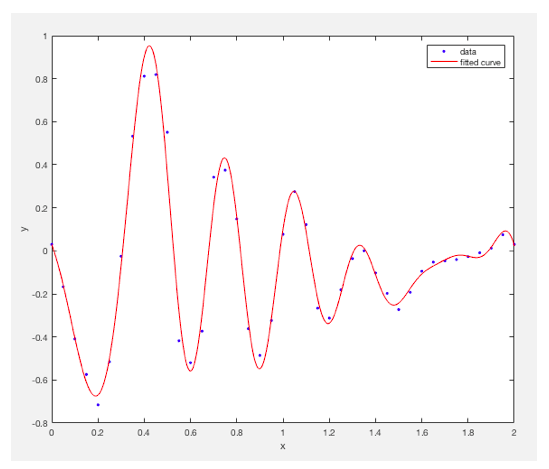
Once we have an adequate function, we can get Y values from the curve fitting tool using the properties of the function given, by generating a “YHat,” function from the fit curve, as follows:
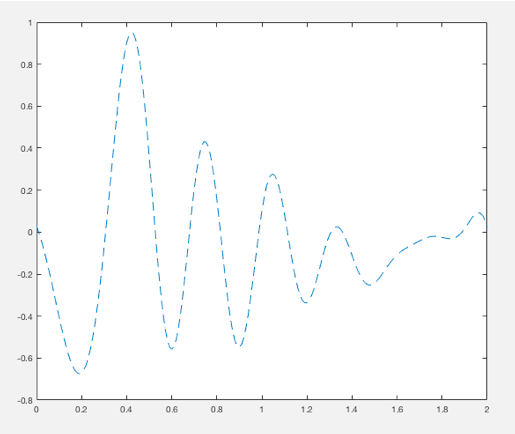
We can generate multiple signals which mimic the antenna arm articulation graph as shown above:
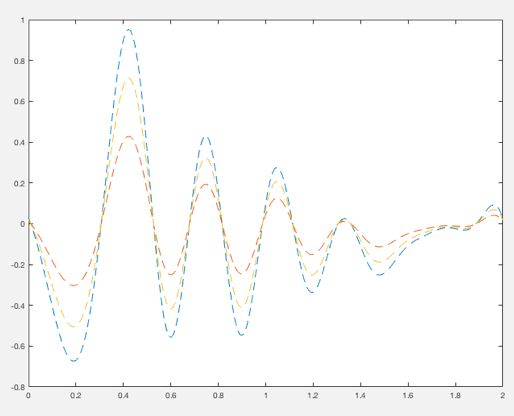
Several signals can be set at various points to mimic spoofed (e.g. non-articulating antenna arm data sent from a meacon source) as well, as shown below:
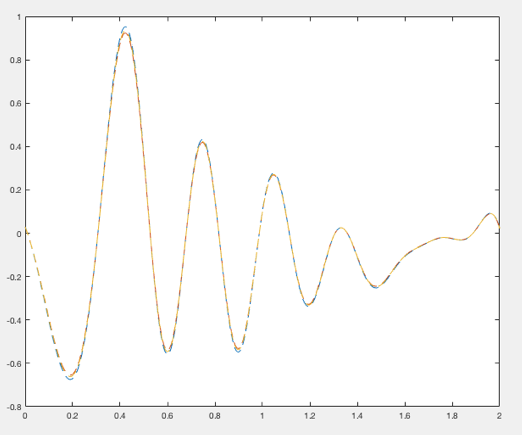
This data can be further randomized. We note that on the above charts the randomization magnitude is similar on both the articulating arm and the spoofed data, so we will randomize each similarly and shown below. We see that the randomization is approximately 10% of the maximum magnitude of the phase cycle measurement, across the board.
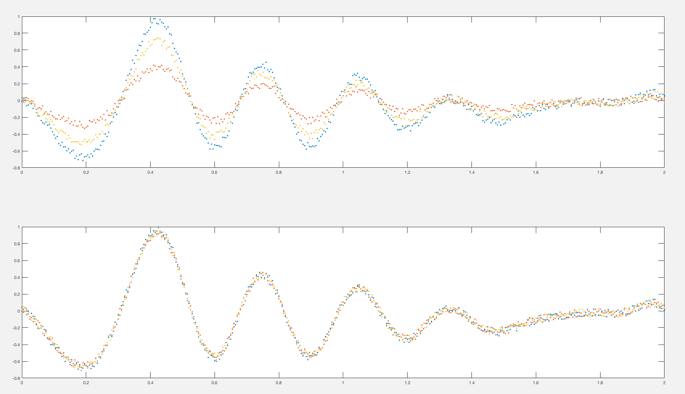
The above first graph shows differing decaying sinusoidal oscillations with randomized data points, as would be expected with an articulating arm antenna spoof detection system, detecting real satellites only. The second shows identical decaying sinusoidal oscillations which would be expected through detecting a spoofed signal with the articulating arm.
Looking At The Device Theory From a Purely Mathematical Standpoint
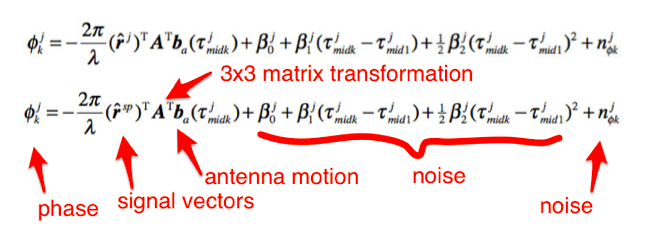
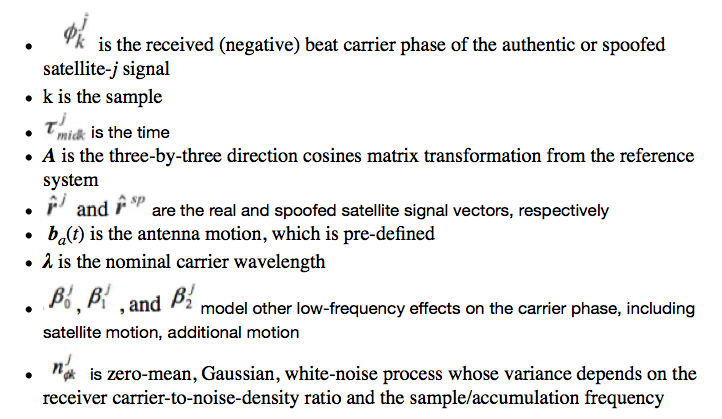
To simplify the understanding, what you really need is:
- [ r ] - Satellite Signal Vectors
- [ A ] - 3x3 Cosine Matrix Transformation to “Smooth Out,” the Signal
- [ b ] - Knowledge of Antenna Motion
- [ Beta, n ] - Noise, unknown quantities
Figuring Out A Custom Hypothesis Test
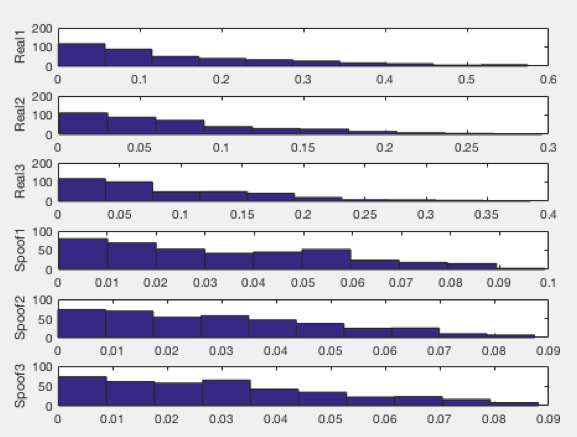
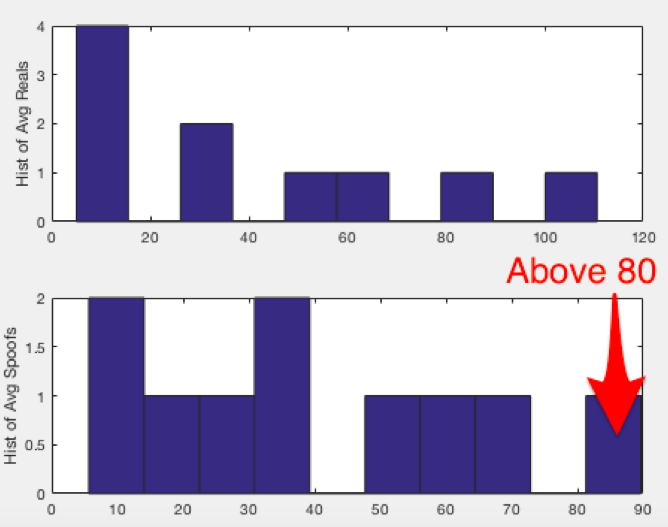
If we look at the top three histograms, which represents the difference between each of the three real signals and spoofed signals (e.g. each histogram representing the relationship between two satellites), we notice that the average of three real signals (closer to 100) is much higher than the average of the three spoofed signals (closer to 50).
How Shall We Set Up a Hypothesis Test?
We have a distribution which is highly slated toward one side of the histogram. We can use this shape to create a hypothesis test based upon a pre-existing distribution class inherent in Matlab, or we can design our own custom distribution.
However, if we look at the data characteristics of the averages, we can see that there may be a simpler way to set up a test than comparing data patterns. If we look at the histogram of averages of satellite relationships as shown above, we see the following type of chart. The below histogram is actually a histogram of an average of three histograms, each corresponding to the difference between each satellite phase signal:
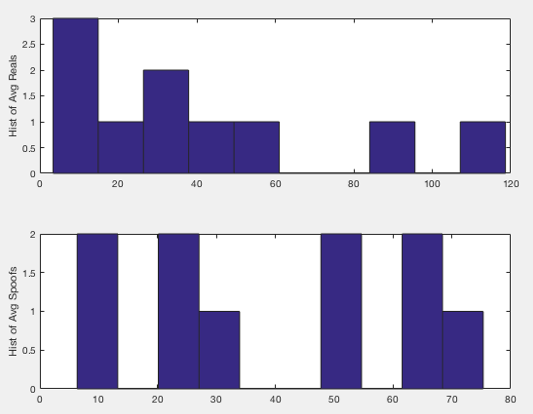
Note that the average histogram of the, “Spoofs,” includes counts of the difference which are all lower than 80. So we can create our own hypothesis test function which is of the following form:
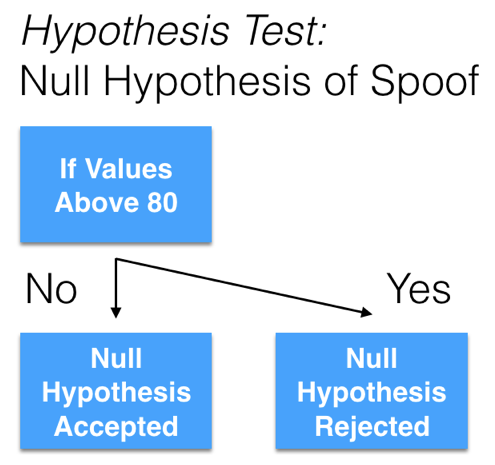
Of course, the quantity, “80” is a set point which can be changed according to the sensitivity that is needed to fit the spoof-detect application.
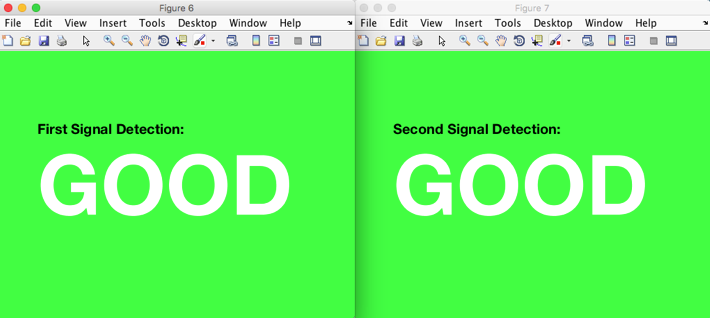
Upon setting up the appropriate if/else code, we can determine whether the spoof null hypothesis was accepted or rejected given the, “80” value.
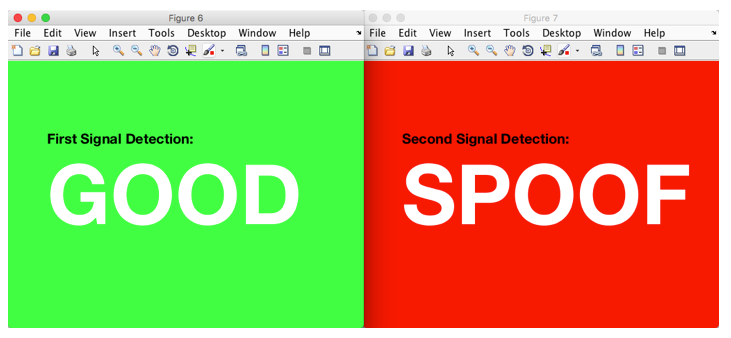
That being said, it is important to note that these below results do not represent, “spoof,” or “no spoof,” but rather the “Good” signal represents the rejection of a “Spoof Null Set Hypothesis.” That is, the default hypothesis is that there is no spoofing going on - but upon receiving a certain type of signal transform as noted above, “spoof,” is the accepted result.
Tuning the Simple Test
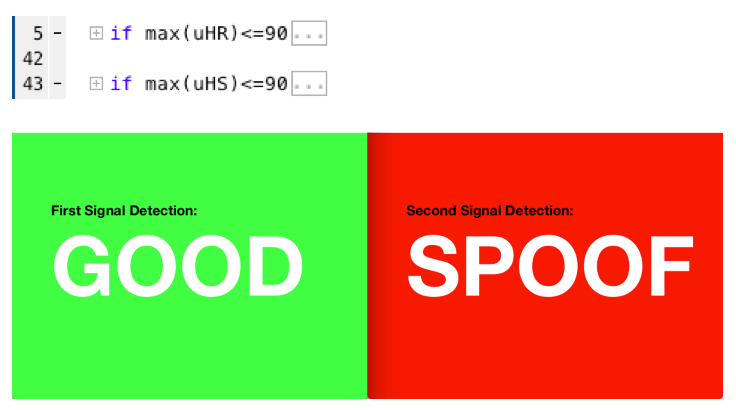
If we run the test multiple times, we can see that there is a chance that we will not receive a rejection of a Spoof Null Set Hypothesis, even though a spoof was present.
This can be tweaked in our very simple algorithm by simply adjusting the set point to 90 rather than 80, as shown below.
Improving Upon the Algorithm Given Simple Algorithmic Tools
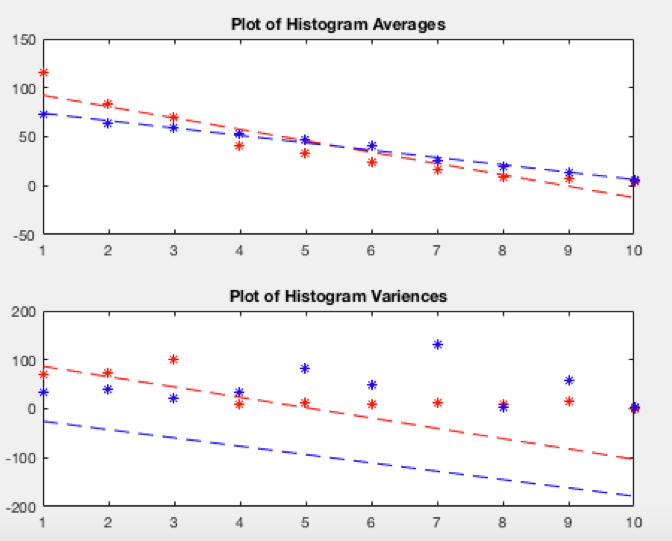
To really improve upon spoof detection to a fine-grain amount, one must adapt a system such that a given spoof curve will use more complex hypothesis test which compares a given shape of a histogram to a certain class of extant histogram within the given computing environment. This type of testing must be improved over time through testing done in a laboratory setting. That being said, if one wanted to play with the types of variables we have made available in this report, one could use additional curve fitting tools inherent in the data and build a hypothesis test based upon the curve fit of the histogram of averages, as shown below.
What If The Satellites Are Really Close To One Another? Or What If The Noise Is Increased?
As mentioned above, going into more accurate spoof detection methods involves comparing different distribution patterns to the distribution patterns we receive in our detection methods described above. If there is environments with increasing noise or decreasing satellite spread, making the difference relationships smaller, we can use different types of hypothesis testing methods that can be tested using tools already existing in Matlab, and later written into a computing environment. One example hypothesis test we can use, which does not require the purchase of a Signal Processing MATLAB package, is the Burr Distribution method:
Burr Distribution Method
Hypothetically, we could use a Chi-Squared hypothesis test to determine if our profile fits a given Burr distribution profile that we’re looking for. This would hypothetically be more accurate than the simple, “cutoff method,” described above - but of course that set distribution curve would need to be determined experimentally and shown to be reliable. There are other forms of common distribution patterns we could model after - this is merely one example.
Hypothesis Testing Using the Original Neyman-Pearson Lemma
Neyman-Pearson lemma
Basically the Neyman-Pearson lemma is a hypothesis test just like the above, “cutoff method,” where we either reject or accept a null set hypothesis based upon whether a transform curve fits a certain cutoff parameter. This is different than a, “fit test,” where multiple data points are being tested, but it is more precise than the, “cutoff method,” because it is looking at the entire curve rather than one point on the curve.
- A True Neyman-Pearson test would hypothesize a-priori distributions for unknown quantities and integrate their dependencies out of joint probability distributions.
- This function is built into the MATLAB signal processing toolbox and could be built within that environment prior to lab testing environments.
True Signals Hypothesis
Spoofed Signals Hypothesis
Benefit and to Whom
This project was done for a remote client.
Project Status or Outcome
The full project results are discussed above.
References
Check out my Portfolio
Internet of Things, Machine Learning
Share