Open Source Smarthome Data Cleaning Project
Jan 09, 2019
Smarthome data is an area rich for exploration, with hobbyists and makers having collected and stored all sorts of interesting ambient data around their homes for years. This is a look into cleaning data from a smart home data dump.
Project Summary:
Smarthome Data Cleaning Project. Open source code and data hosted on Github.
Background Rationale
Smarthome data is an area rich for exploration, with hobbyists and makers having collected and stored all sorts of interesting ambient data around their homes for years. A friend of mine, who will go anonymous, provided me with the following data that s/he captured:
- 4 months of door open / close data for our front and back door
- 2.5 years of temperature and humidity data for second floor of our house
- 19 months of temperature and humidity data for the first floor
- 9 months of tVOC data for the first floor
- 9 months of temperature and humidity for the basement
- 9 months of temperature data for the attic space behind our knee wall (to help correlate with ice dams).
The original data was given in a dump file here so the project involved basically:
- Start off with SQL dump, and translate to json format.
- Turn the SQL dump into json objects, to make them workable with a Python3 json library.
- Initial processing here.
- Graphing and cleaning data accordingly, discussed as shown here.
The main focus of our investigation was temperature plotting.
Benefit and to Whom
This is an open source project. There are many smarthome enthusiasts around the world who have put a lot of thought into home automation, but not necessarily ways to clean and display their data. This provides an open source example for the smarthome audience.
Project Status or Outcome
There was one primary insight from the data cleaning portion of this project. Basically any kind of smart home data is going to come with a certain degree of non-sensical messiness to it. In our case, there were temperature spikes which showed many thousands of degrees, which of course would have been impossible because the house would have burned down.
Why did the temperature spikes occur? Looking at the data sheets for the sensors used in gathering the data, it was evident that these temperature spikes merely represented points in time in which the house power fluctuated or cut off completely, and that the analog voltage output translated briefly to high values, which were not reflective of reality.
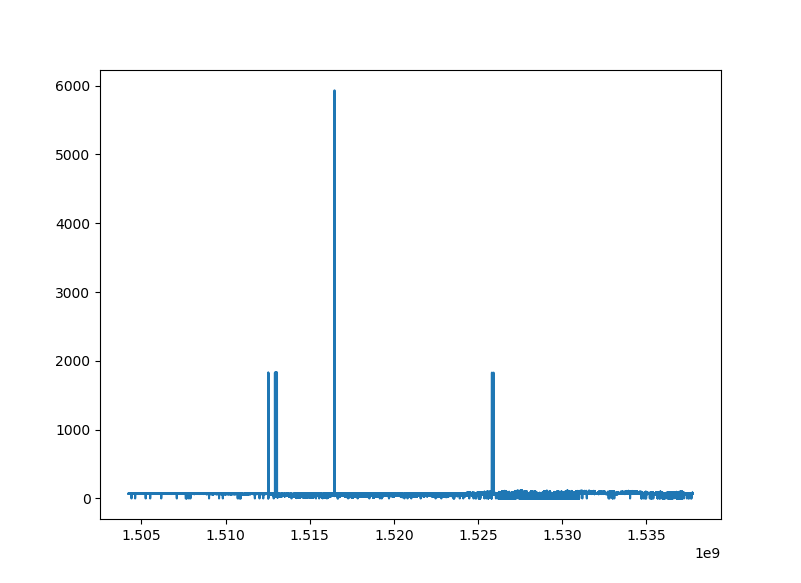
This suggests the need for an overall data cleaning algorithm which simply truncates any data points which are outside of a reasonable ceiling. Further algorithms could be developed which truncate data points based upon a moving average.
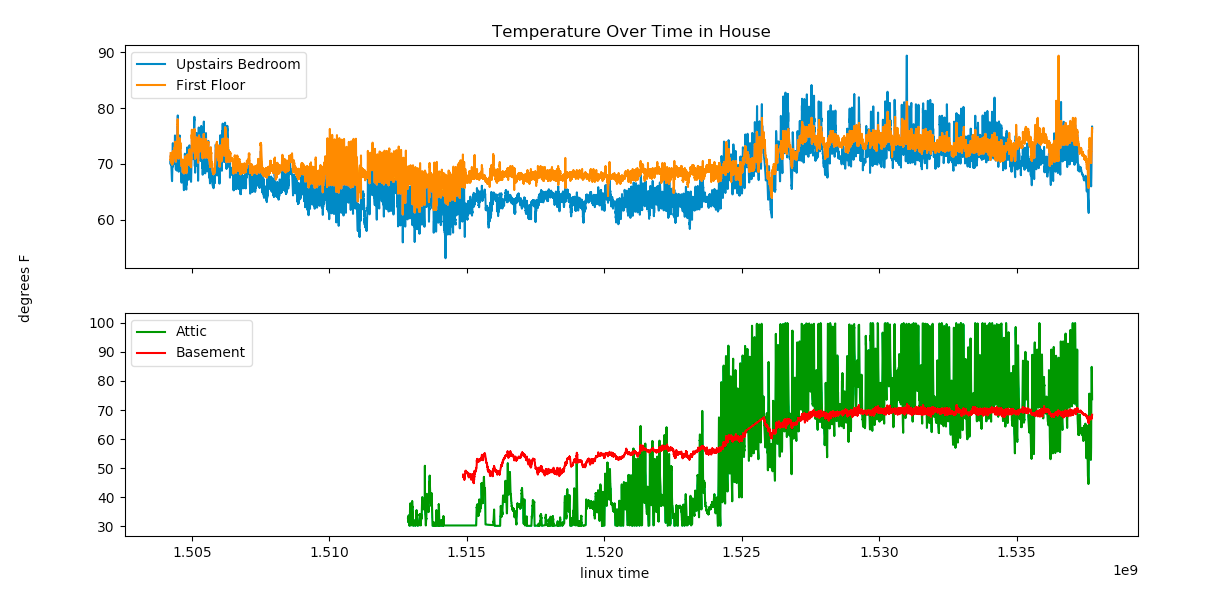
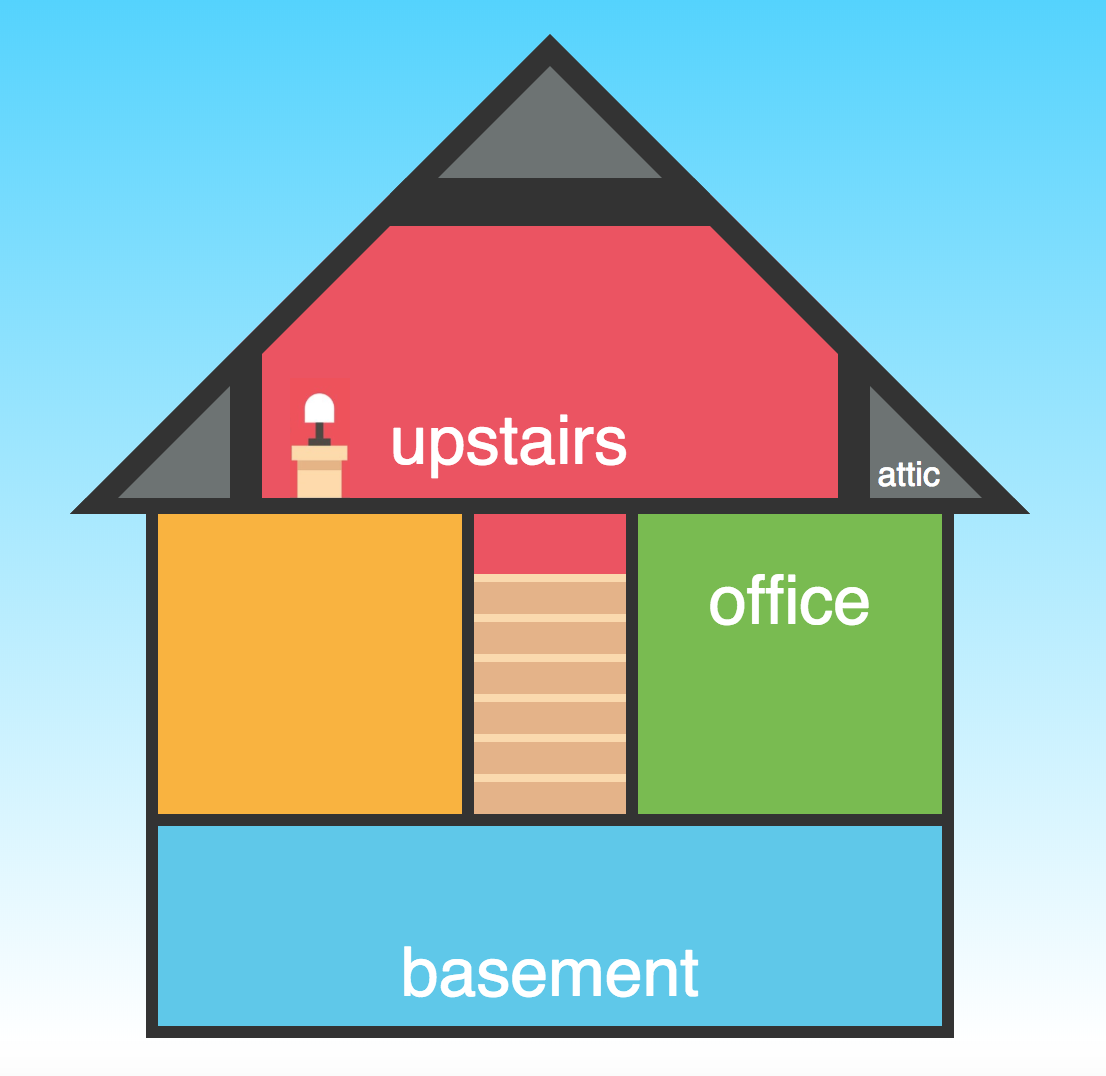
Further analysis shows that different parts of the house, illustrated below, exhibit slightly unexpected, yet sensible temperature behaviors. The attic, being uncooled in the summer, exhibited an above 100 degree F temperature range on a daily basis during the summer, while the basement remained consistent at slightly above 70 degrees F through the summer, which falls in line with observed values. In parallel, main areas of the house show a relatively consistent temperature profile through the winter, while the house was heated, and fluctuate more frequently during the summer as the air conditioning is turned on and off.
Smart home data analysis is interesting from the standpoint of it being fairly relatable and common to work with, and that there is a significant challenge in making any algorithm which applies generalizable across many homes.
Check out my Portfolio
Internet of Things, Machine Learning
Share